Quarterly Market Review: Q3 2023
By: Paul Dickson, Director of Research and Giri Krishnan, Senior Portfolio Manager
Does a Resilient 2023 Portend Trouble in 2024?
Economic trends continuing through the third quarter prompted the Federal Reserve (Fed) to hike rates again. The Fed cautioned that further tightening, or at least a prolonged period of tight monetary policy, may be necessary. Concerns over the impact on economic activity are growing as it is now 18 months since the beginning of the tightening cycle. Expectations are rising that the surprising resilience of the economy this year - in the face of the most aggressive interest rate hikes since the early 1980s – will lead to a more pronounced recession next year.
Data through the third quarter of the year provided ample evidence that a recession is unlikely to materialize until well into 2024. However, it also points to the Fed’s continued hawkishness in its ongoing battle against inflation. Shifting expectations for the path of interest rates have begun to deflate the “soft landing” narrative and inflate that of a recession only a little further down the road. In addition to signs that the Fed will maintain a “hawkish” posture, the bond market has reacted by selling off, thereby increasing market rates on everything from mortgages to credit cards and beyond. As much as higher rates and tightening credit conditions will help the Fed with its goal of cooling the economy -- and therefore inflation -- it also increases the risk of recession.
Inflation and unemployment remain stubborn.
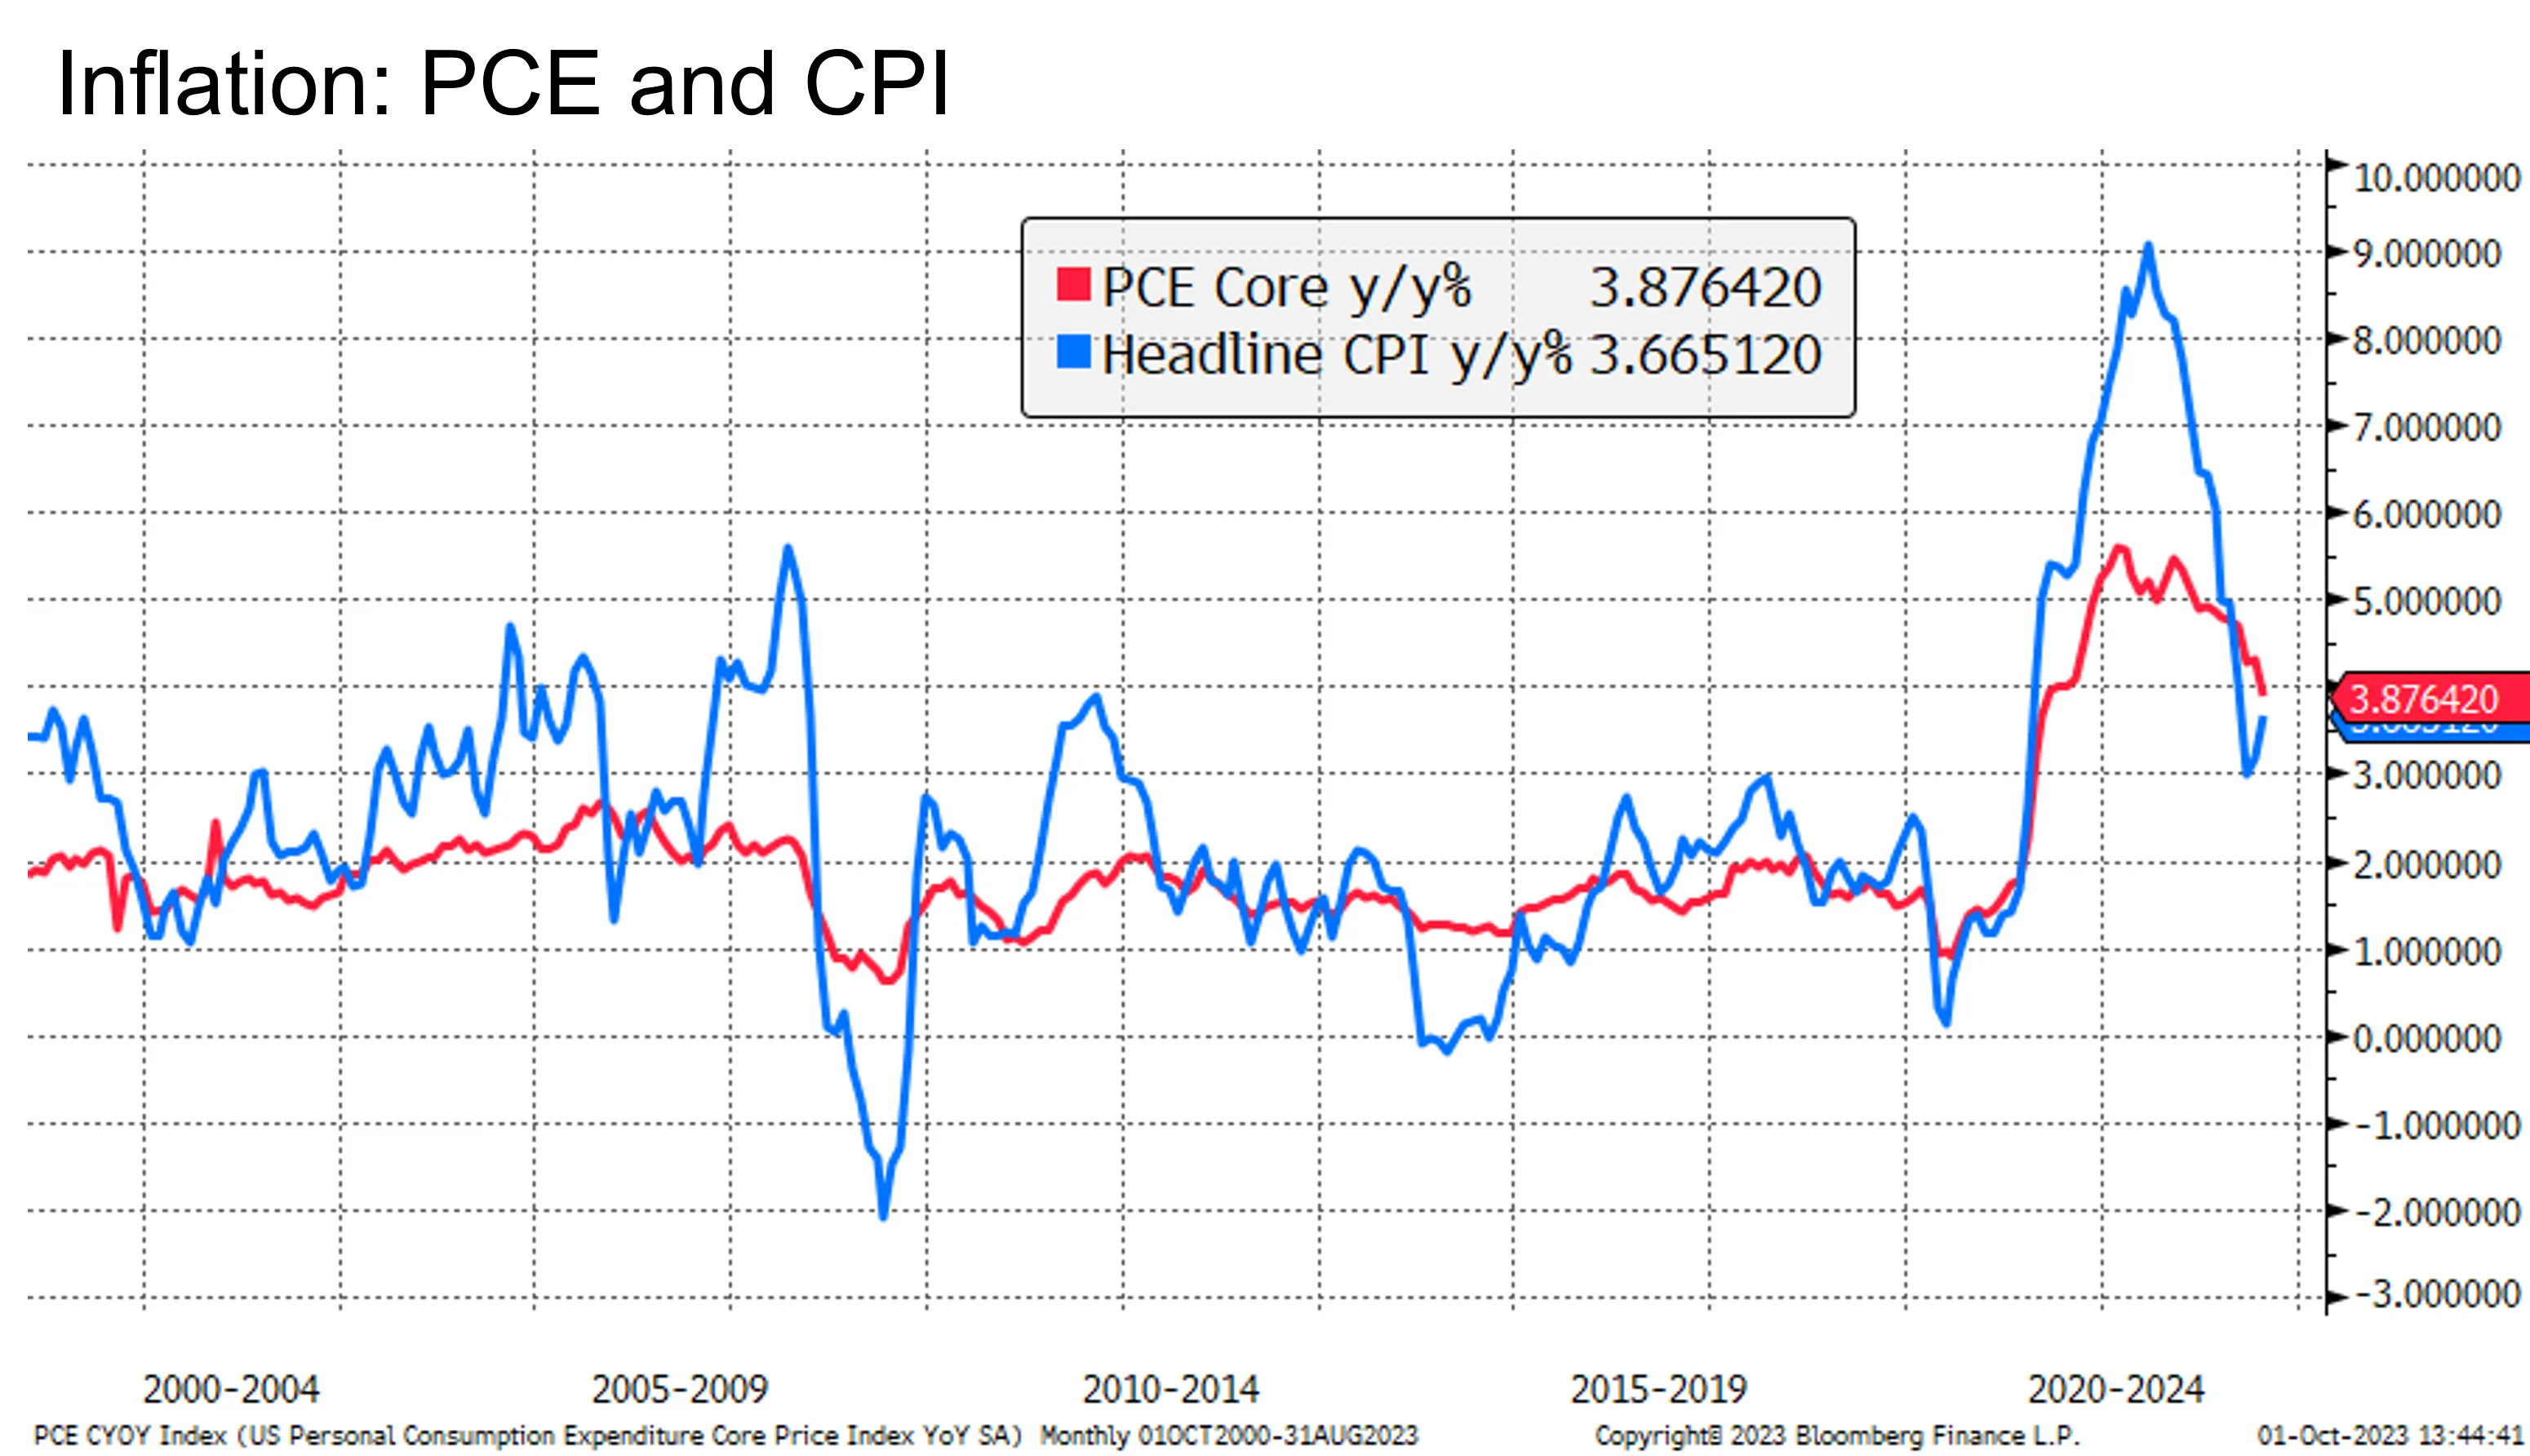
Inflation trended down during the quarter but slower than the Fed would have liked. The headline Consumer Price Index (CPI) fell to 3.0% year-over-year in June before ticking back up to the latest reading of 3.7% - a significant move in the wrong direction. The Fed’s preferred measure, the Core Personal Consumption Expenditure Index (PCE), finally fell below 4.0% to 3.9% year-over-year. Unfortunately, the almost 5.0% inflation in the services sector remains a source of concern. The U.S. economy has become increasingly services oriented over time, and thus, could have a greater impact on wage inflation. According to calculations by the Atlanta Fed, wages have been increasing at a rate greater than 5.0% and risk pushing inflation higher as companies adjust for costs. The recent spate of labor actions, largely seeking higher compensation, highlights the issue.
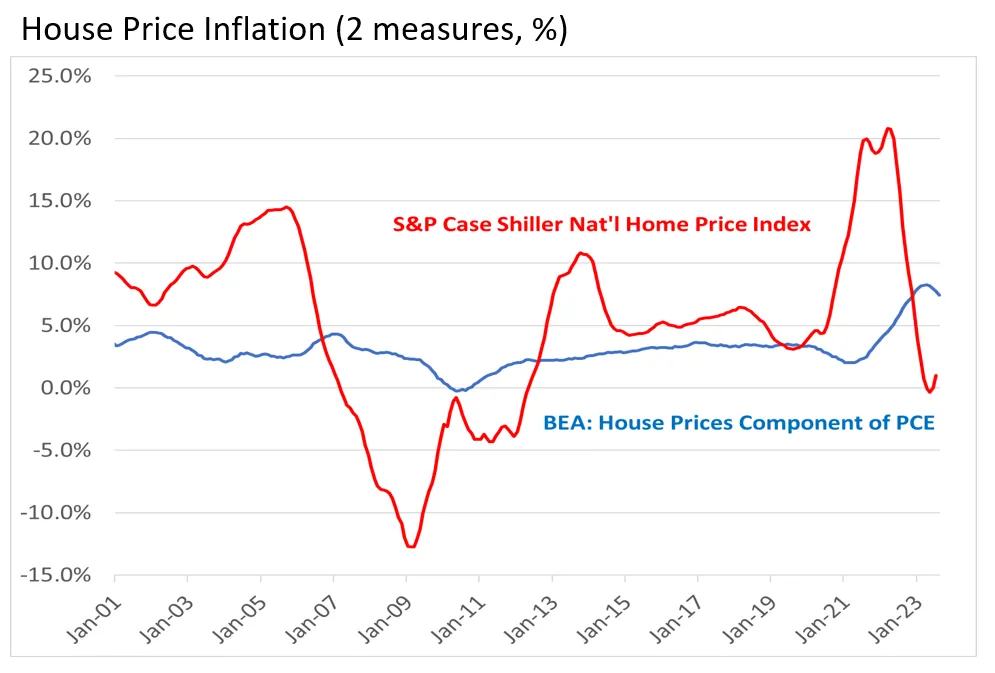
One possible silver lining, however, is the potential for a significant decline in housing inflation over the coming months. Housing accounts for over 30% of both main inflation indices, and the official measure of housing in both the CPI and PCE relies on surveys of what homeowners believe their houses might rent for. Many economists agree this is a flawed measure, as evidenced by the fact that it missed the housing “bubble” of the mid-2000s. The chart here compares a private measure and the official one. Given the rise in interest rates over the past year and the decline in house affordability, it is unlikely that house prices are still rising at greater than 7.0% annually. Even Fed Chair Powell has admitted that the housing measures of inflation are lagging.
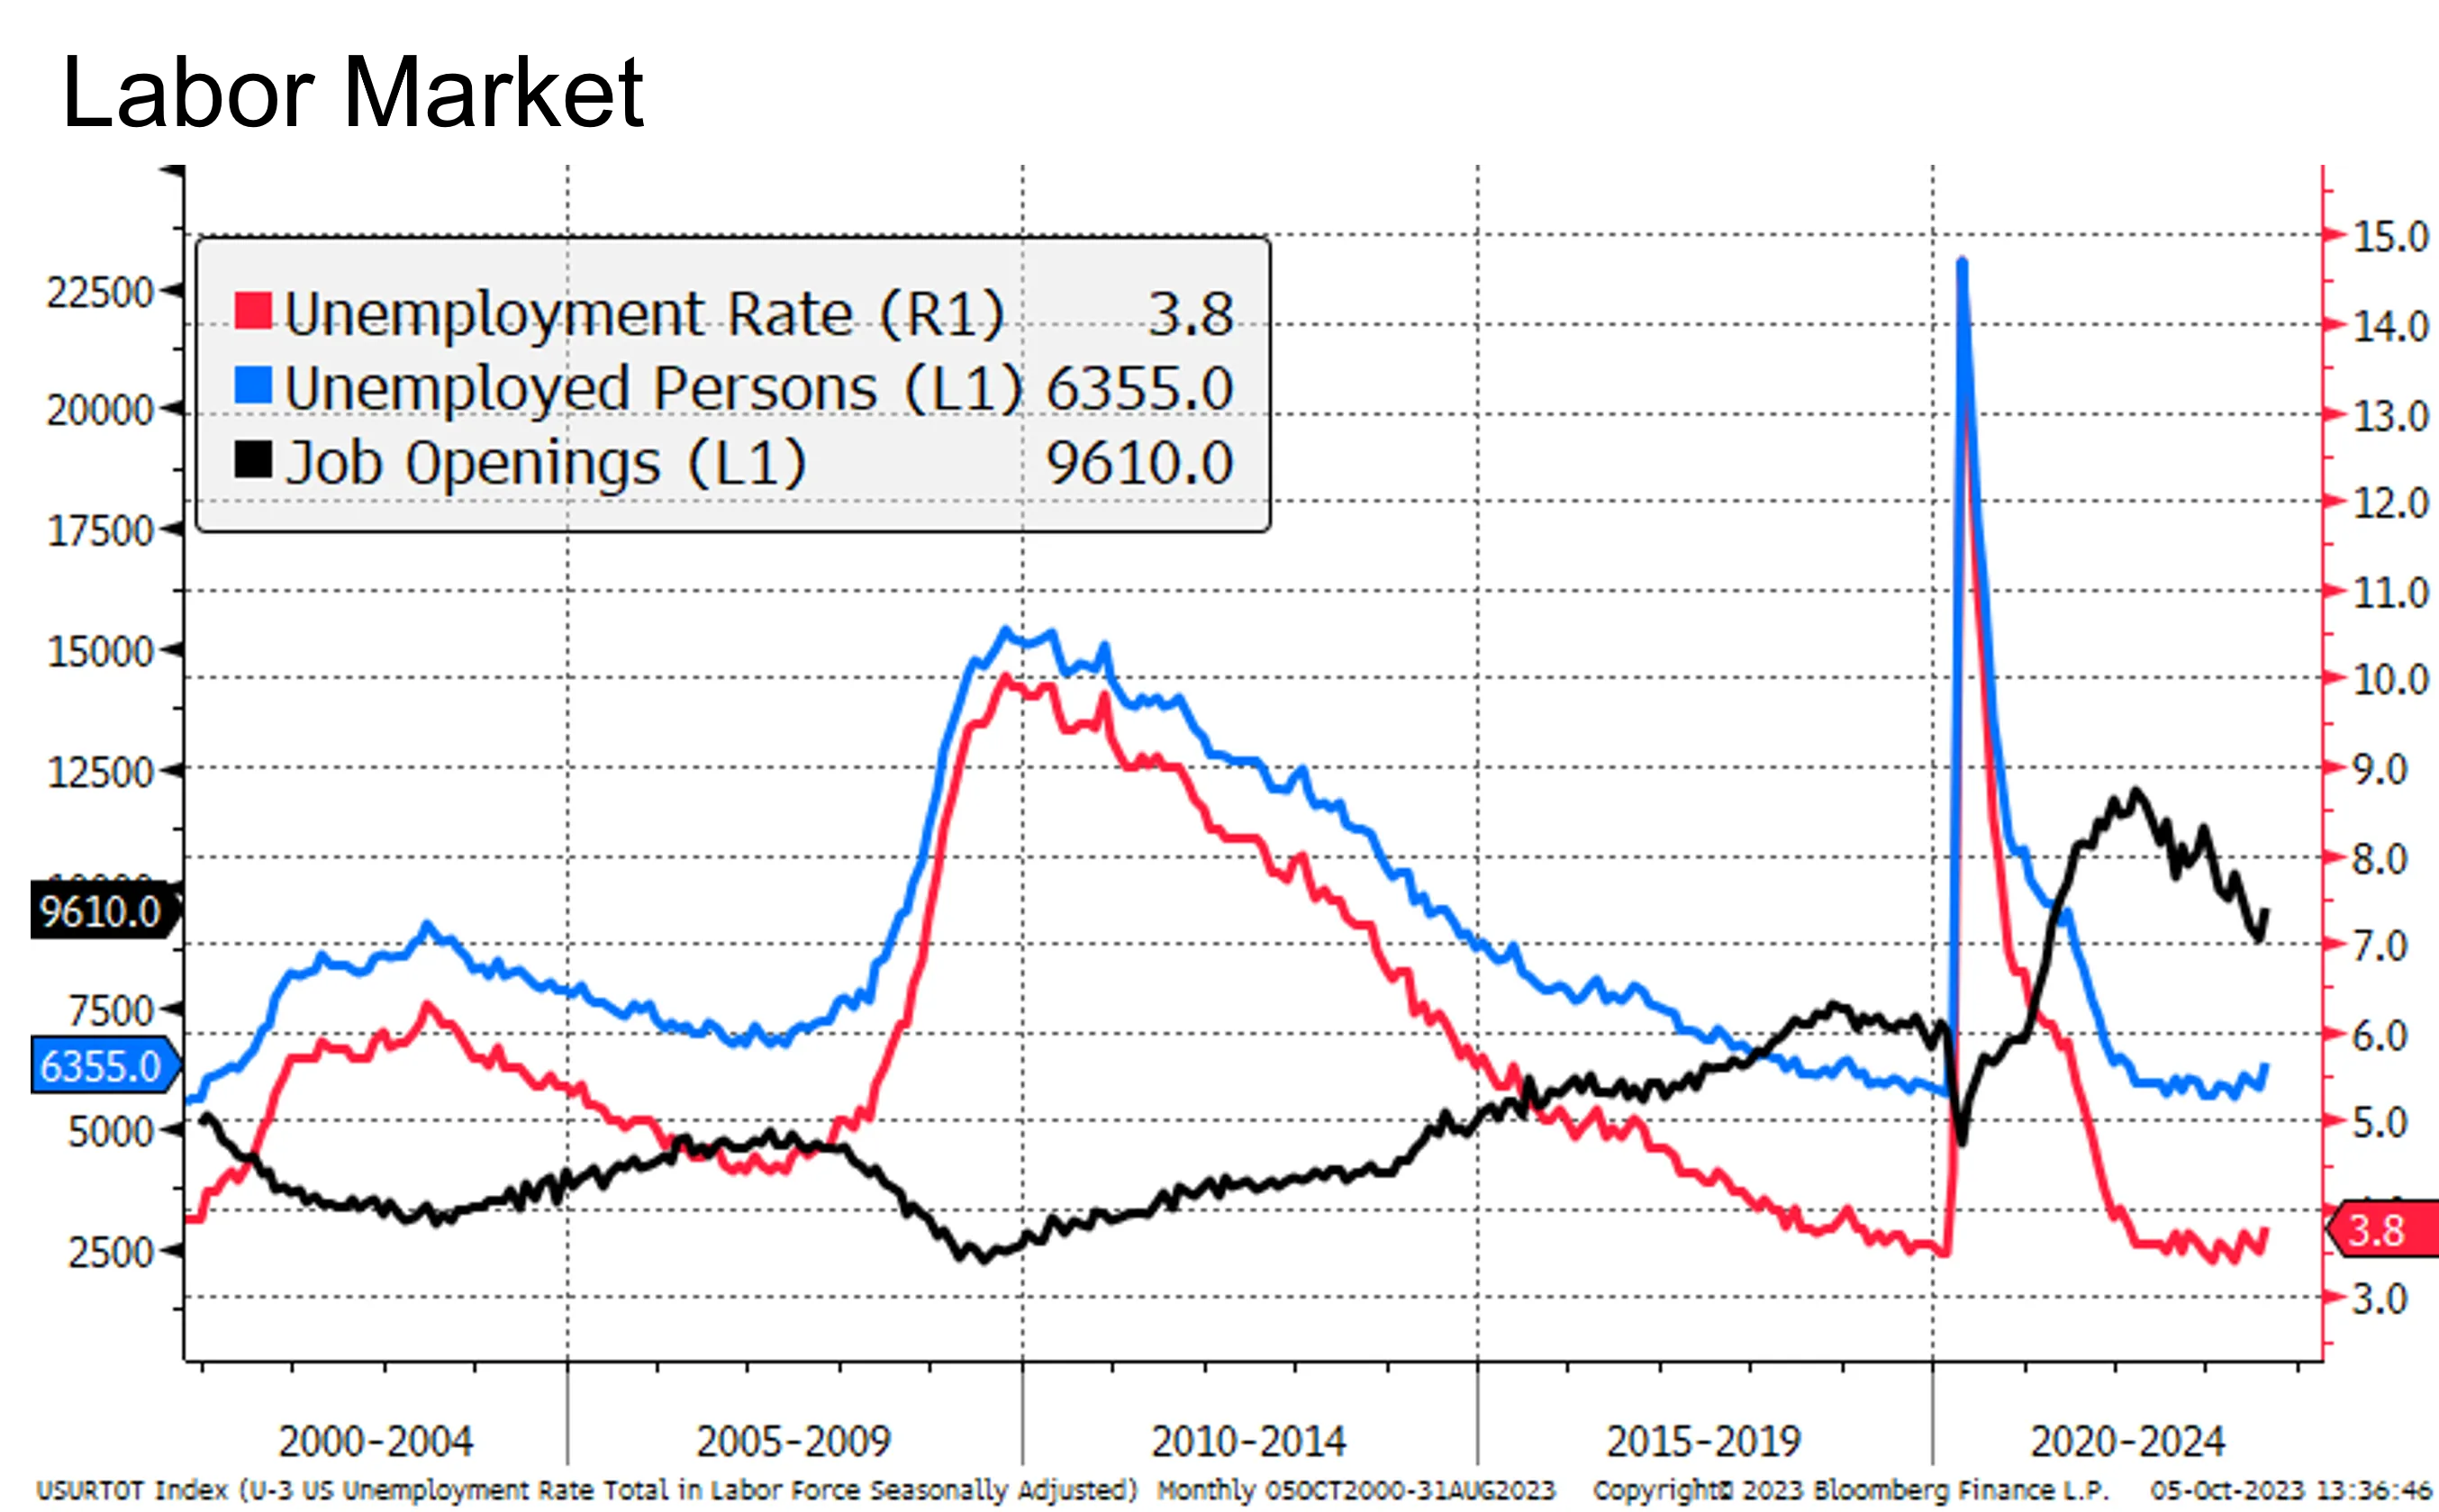
Regarding the labor market, the unemployment rate rose a mere 0.1% over the quarter, demonstrating that conditions remain very tight. Job openings have fallen and no longer account for twice the number of unemployed persons. Still, they continue to show a labor market significantly out of balance – historically so. Most economists believe that a weakening of conditions there will be vital for controlling inflation, and this has been a stated concern for the Fed.
Conflicting data on the health of the consumer may explain economic resilience.
At the beginning of the quarter, there was a broad agreement that the excess savings consumers had accumulated during Covid would run out soon. A Federal Reserve study also showed that only the top 20% of wage earners still had extra savings and that the bottom 80% had depleted theirs. Spending these savings has been credited with keeping the economy afloat. Their exhaustion should result in a slowdown.
The delay for an economic slowdown was first attributed to the rise in credit card debt (topping $1 trillion for the first time), but a new explanation has emerged. The Bureau of Economic Analysis has revised the official measure of excess savings, which has resulted in an increase from less than $200 billion to over $1.2 trillion. This revision might explain the economy’s continued buoyancy and change the narrative significantly.
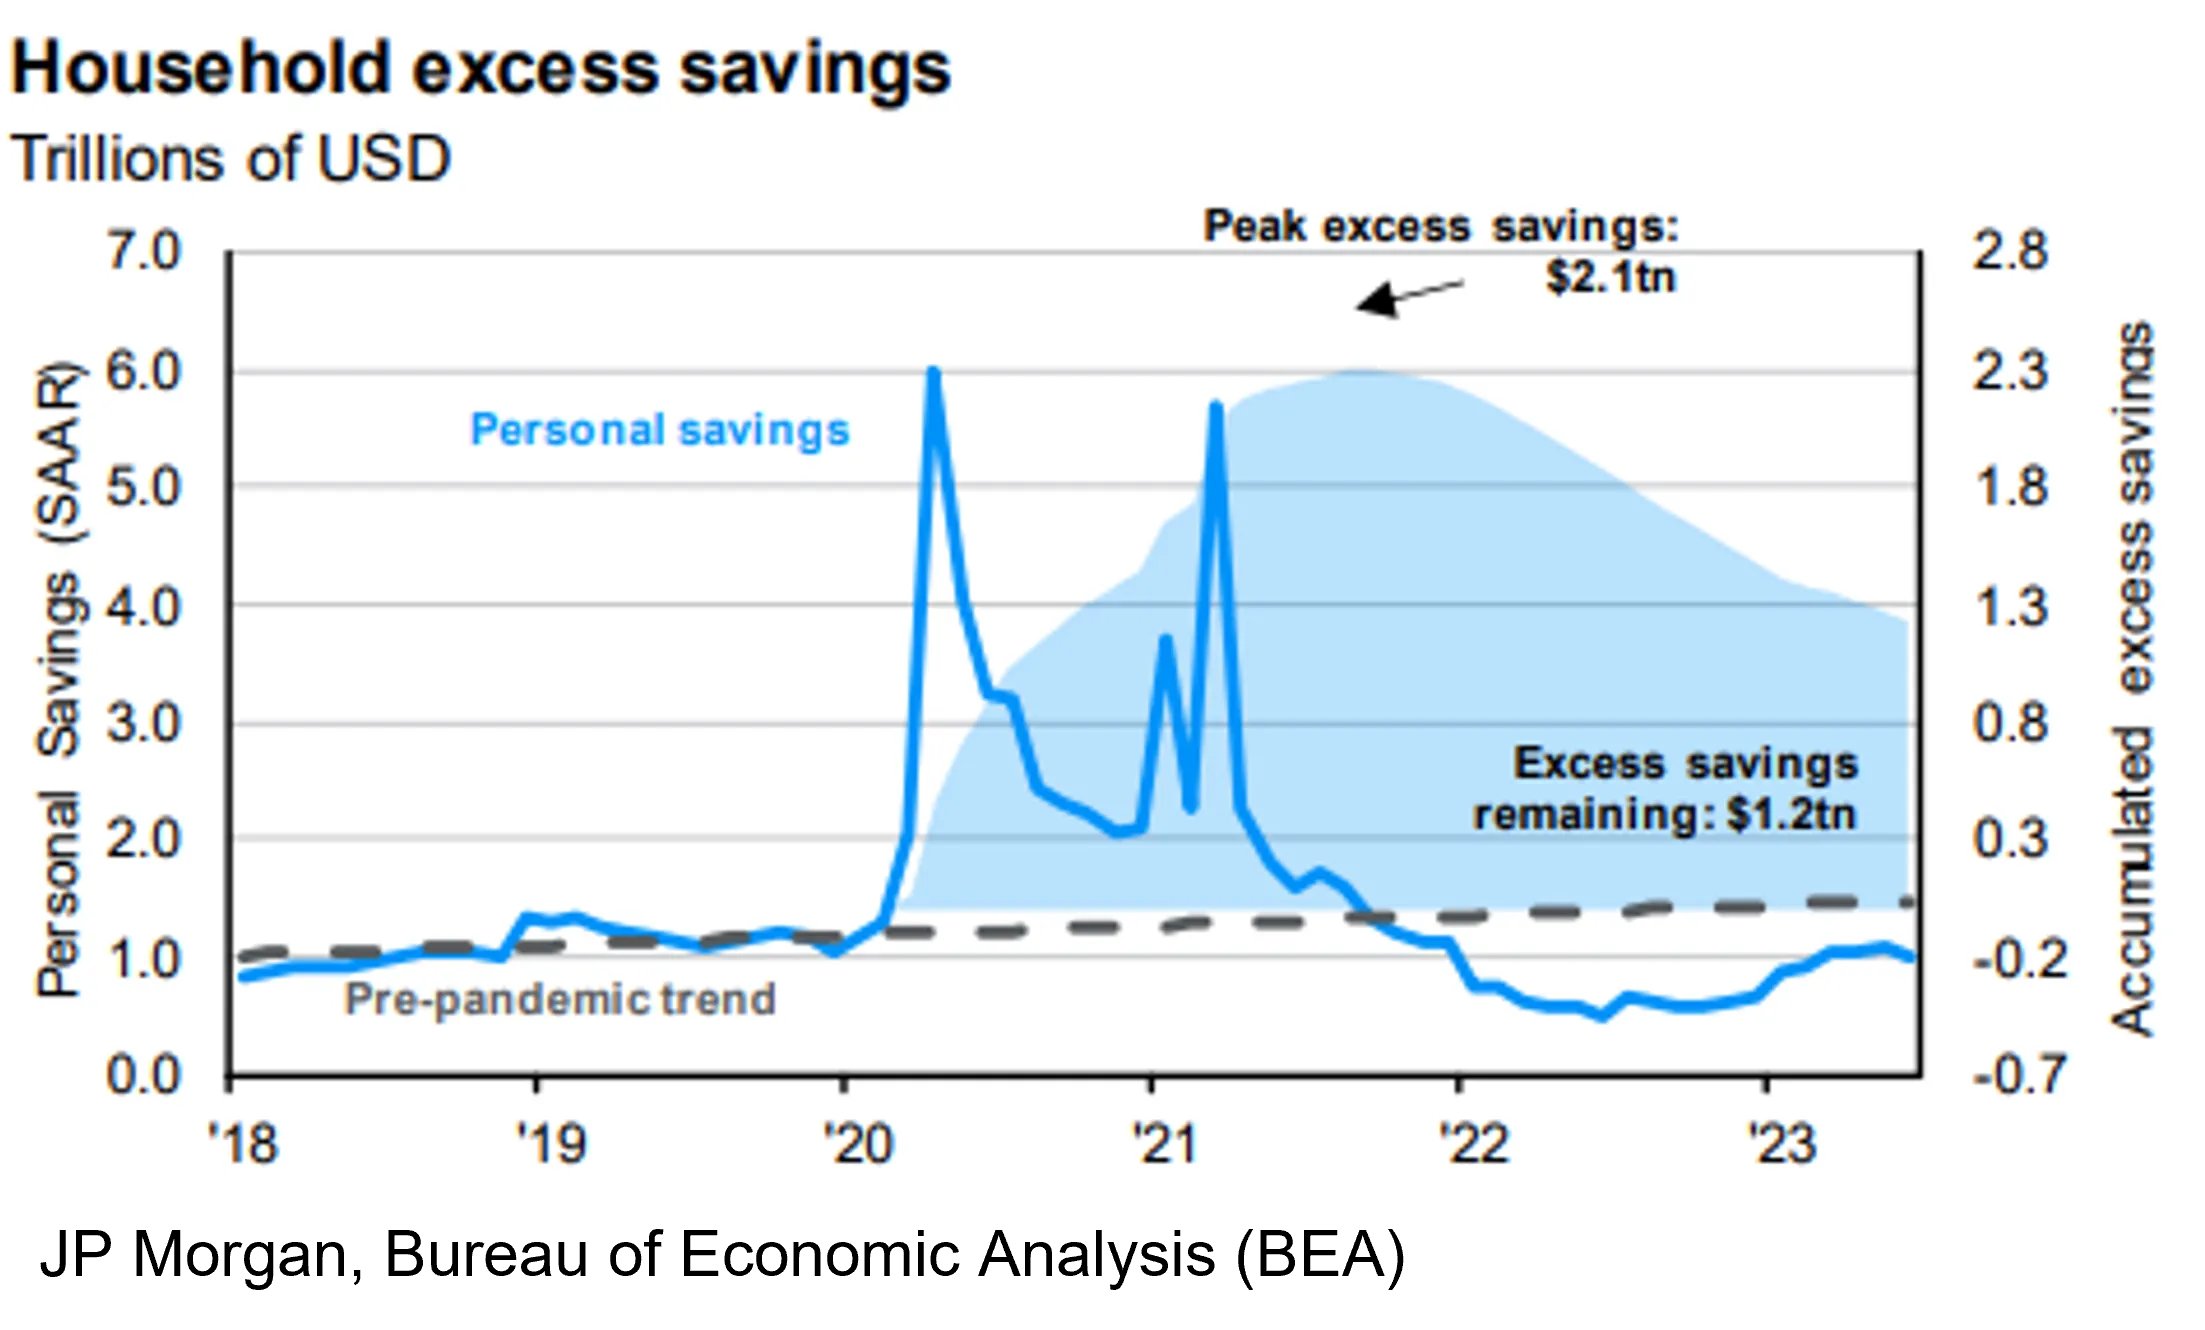
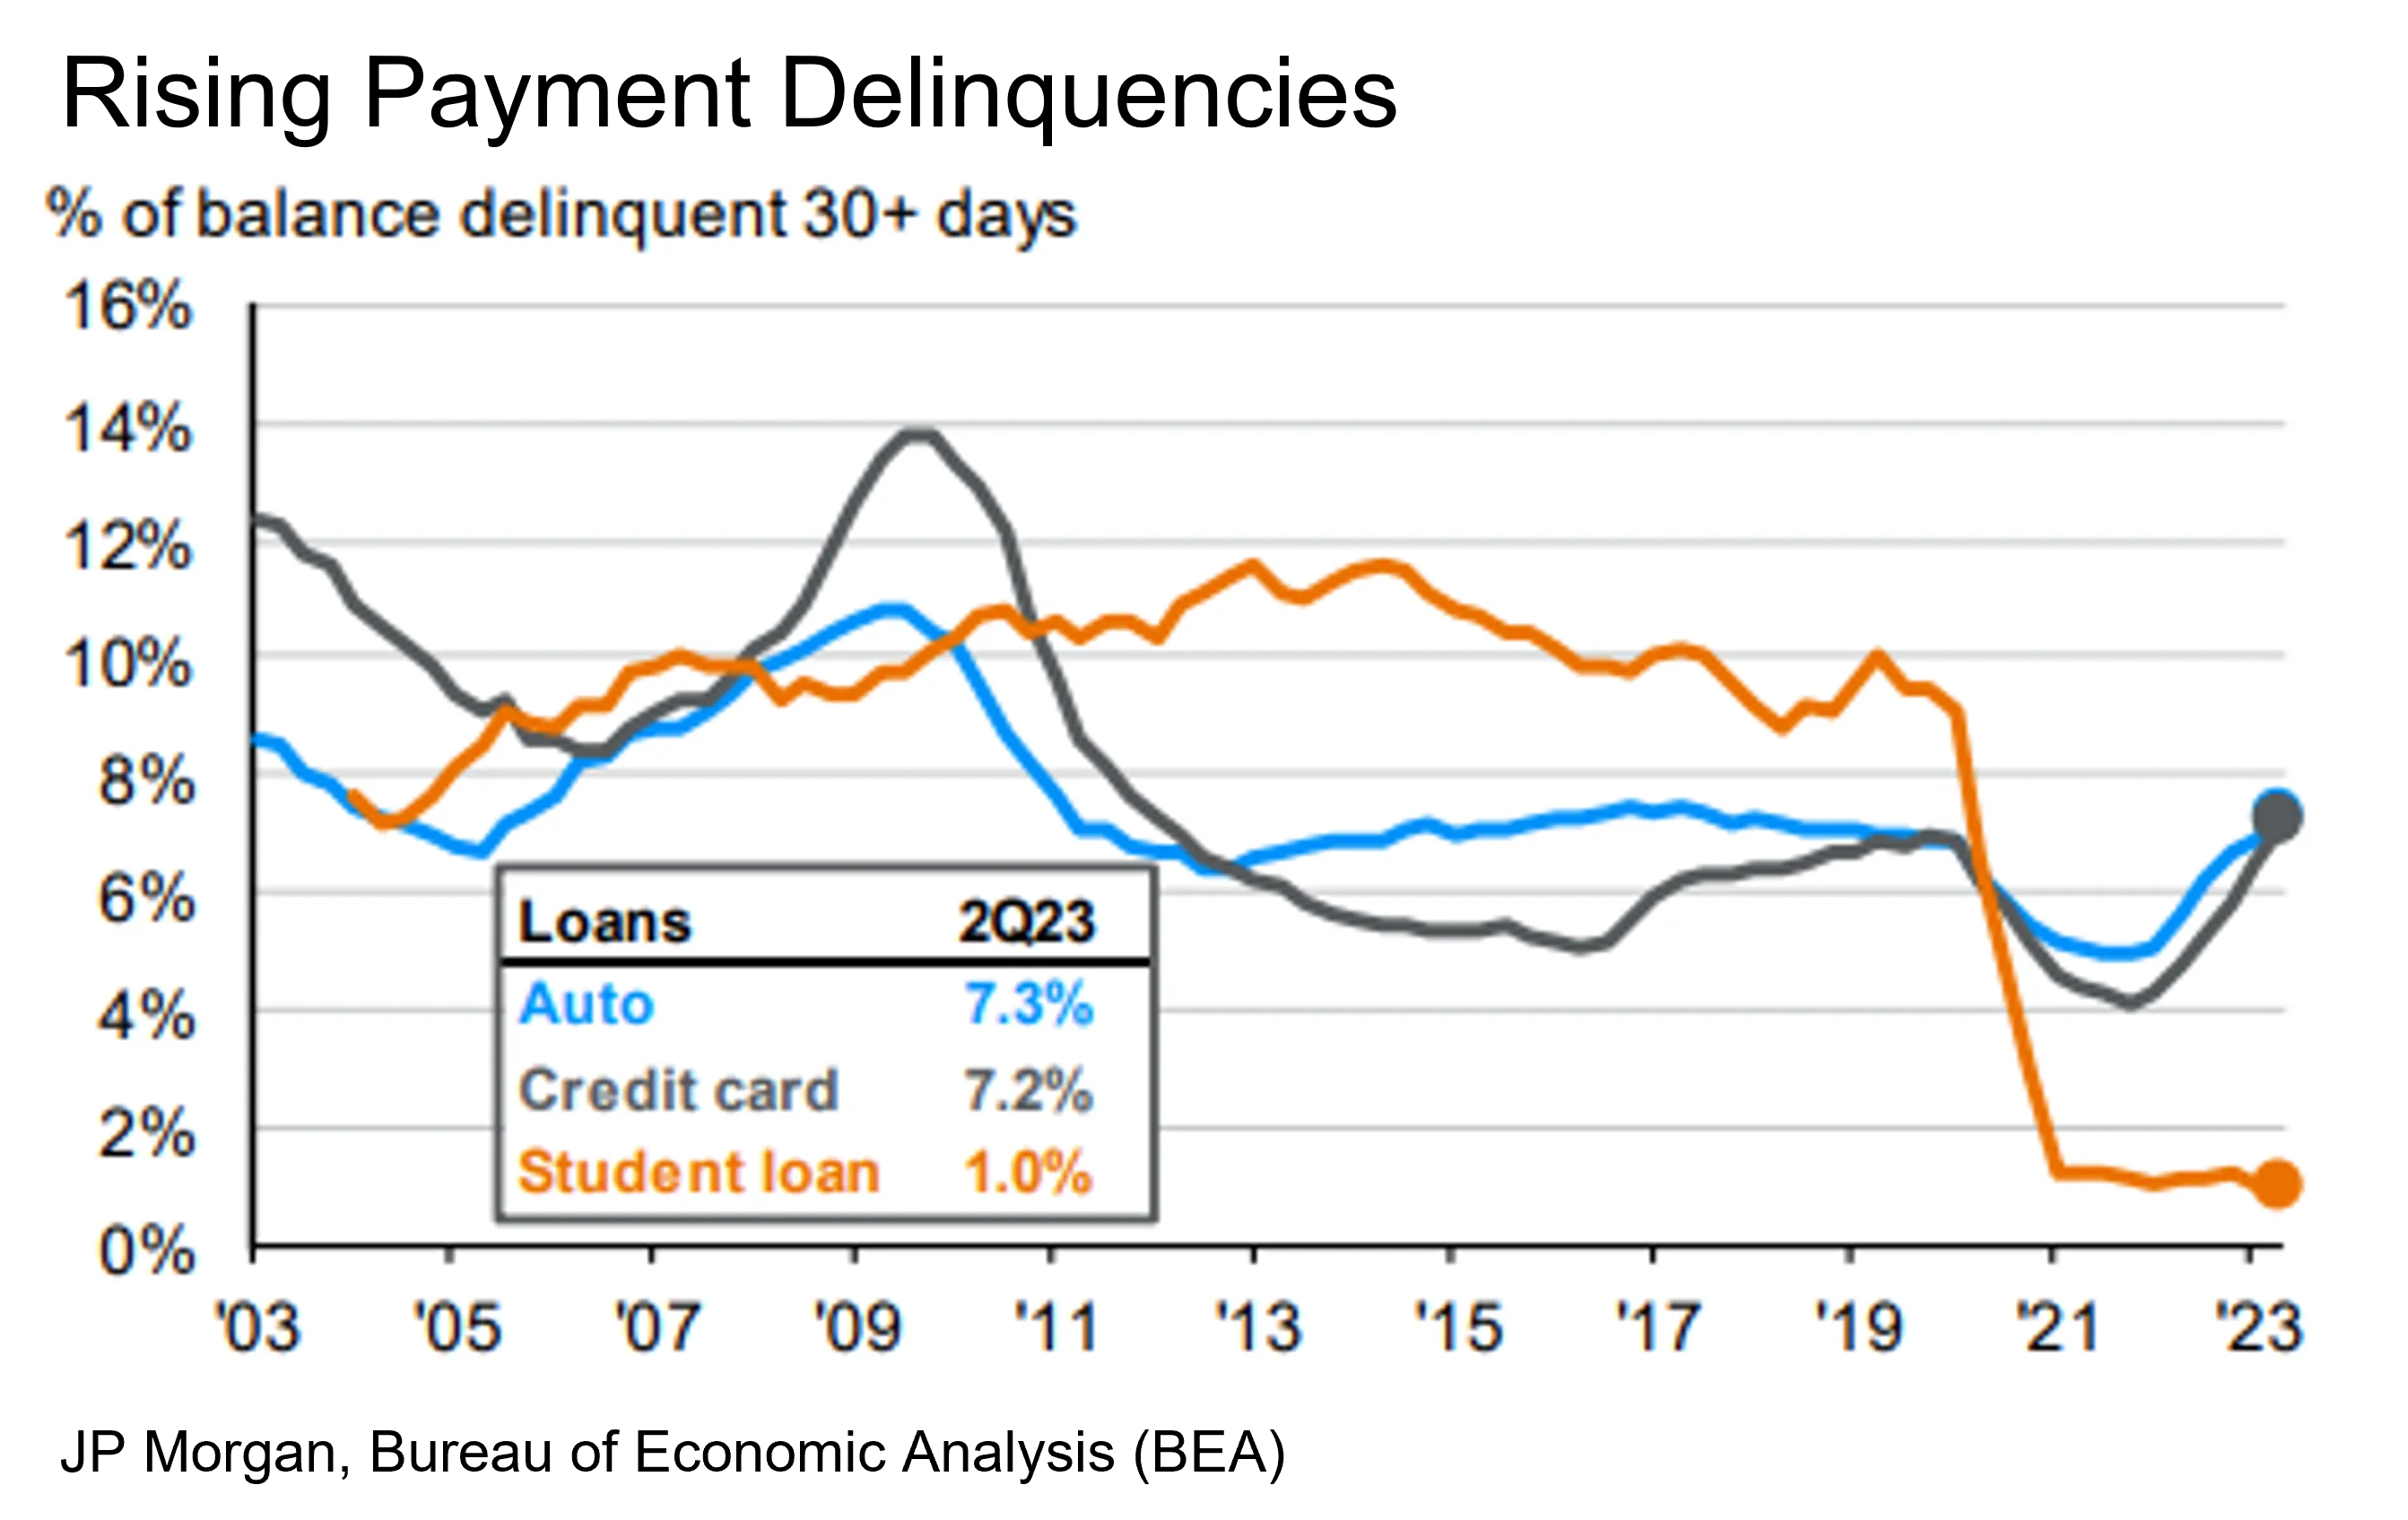
Naysayers will contend that even if there is this level of excess savings in the economy, it remains concentrated in the hands of the top earners as the Fed data suggests. The fact that credit card and auto loan delinquencies have risen to levels higher than they were pre-Covid also supports the weaker consumer theme. Now that student loan payments are set to resume, an additional headwind for the economy has materialized.
Government policy is another explanation for the relative robustness of economic activity. The recently passed industrial policy bills, namely the Bipartisan Infrastructure Law, the Inflation Reduction Act, and the CHIPS Act, have significantly increased investment spending. The deficit for fiscal year 2023 is estimated by the Congressional Budget Office to be $1.5 trillion and rising to $2 trillion in 2024. By some measures, the deficit has increased from around 3.8% of GDP in the first 11 months of the fiscal year 2022, to 5.7% for the same period in 2023. Given that government spending accounts for some 25% of GDP (U.S. Treasury figures, 2022), this larger deficit is a significant near-term stimulus.
Tightening credit conditions should assist the Fed . . . at some point.
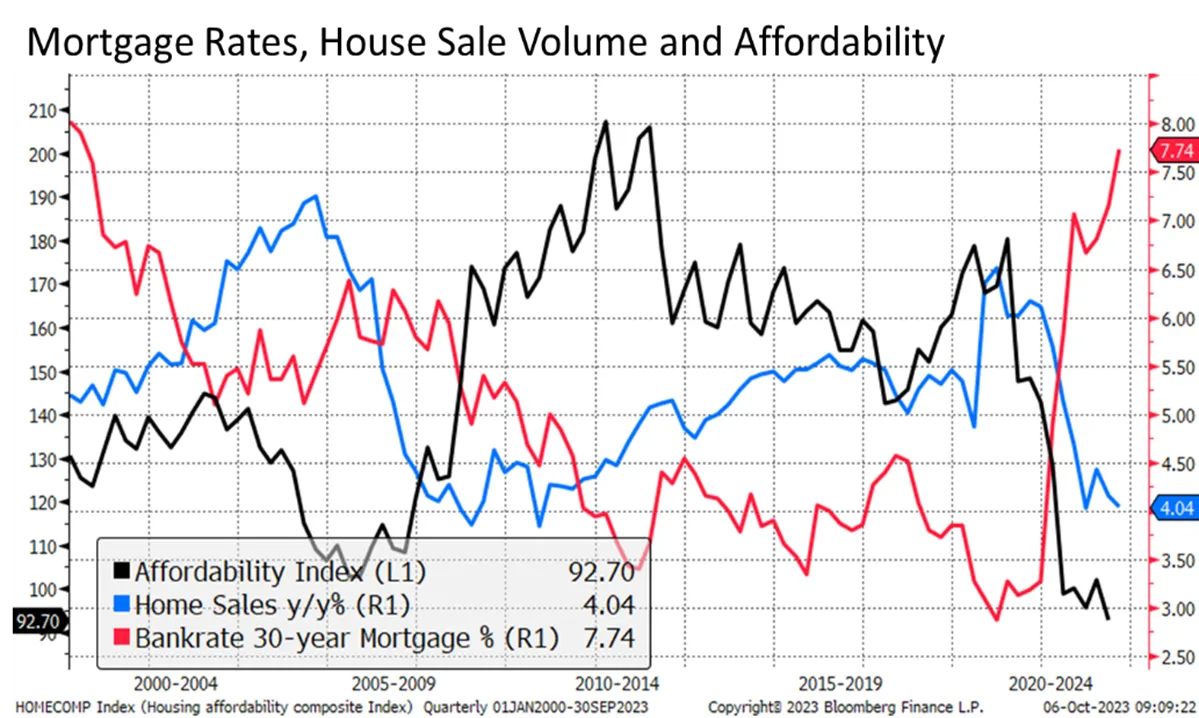
Rising rates alone are tightening credit conditions throughout the economy. Mortgage rates are approaching 8.0%, which is having an impact on sales volumes. The average outstanding mortgage is 3.6%. With the price of housing having risen substantially over the past two years, it is no surprise that affordability is at a multi-decade low, even lower than at the height of the housing bubble.
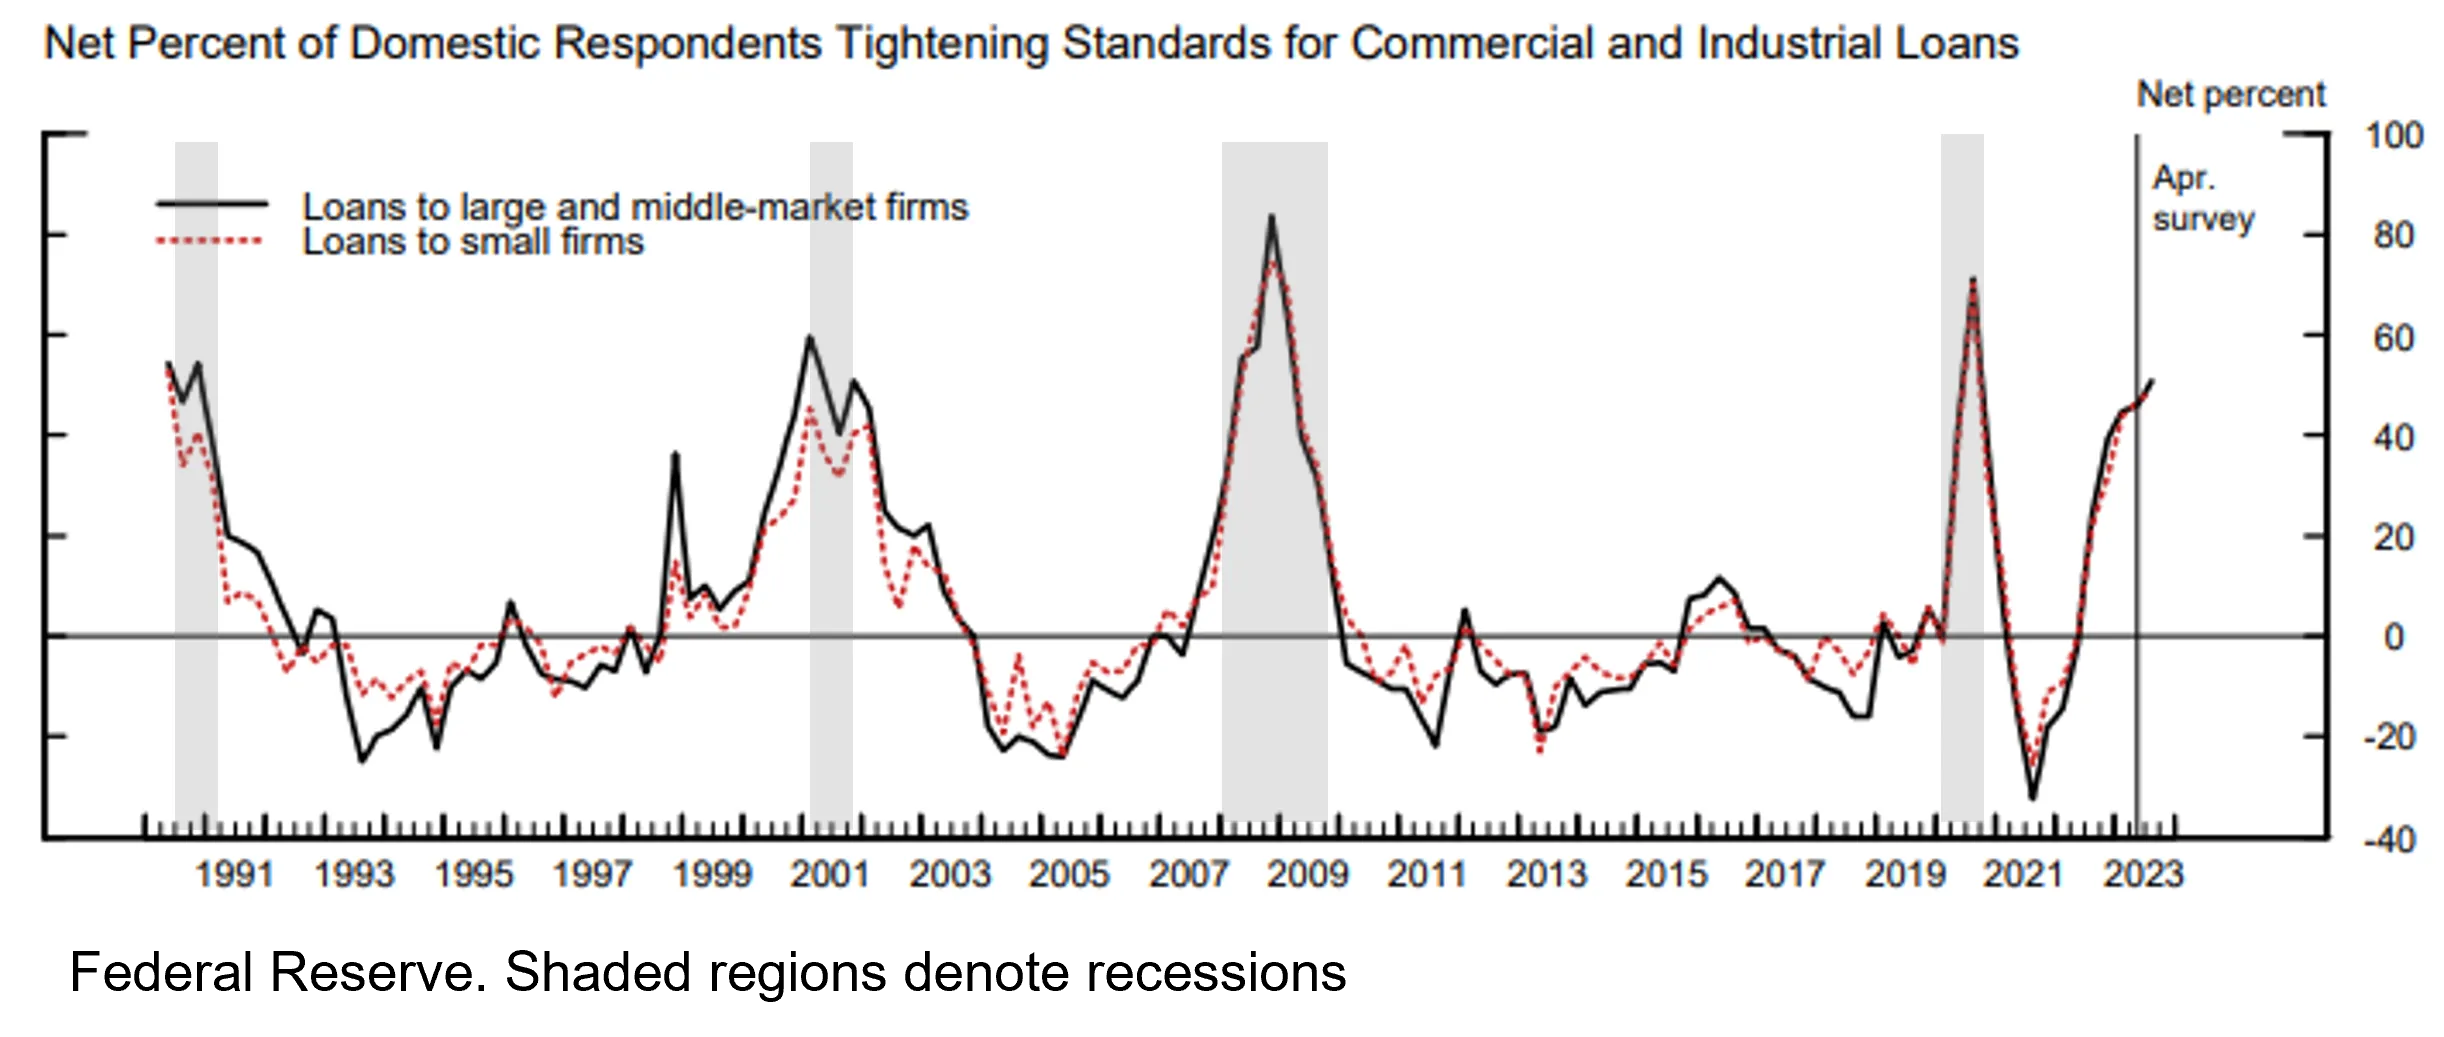
With higher rates, stress on commercial property values, and rising prospects for an economic slowdown, banks have significantly tightened lending standards. The Fed’s Senior Loan Officer Opinion Survey (SLOOS) tracks whether banks are tightening or loosening lending standards. As the data shows (with a lag), lending standards have been tightening since 2022, even before the limited banking turmoil earlier this year. It is difficult not to expect a significant slowdown at some point because of higher interest rates, rising delinquencies, and tighter lending standards.
But there are “Long and variable lags” to consider.
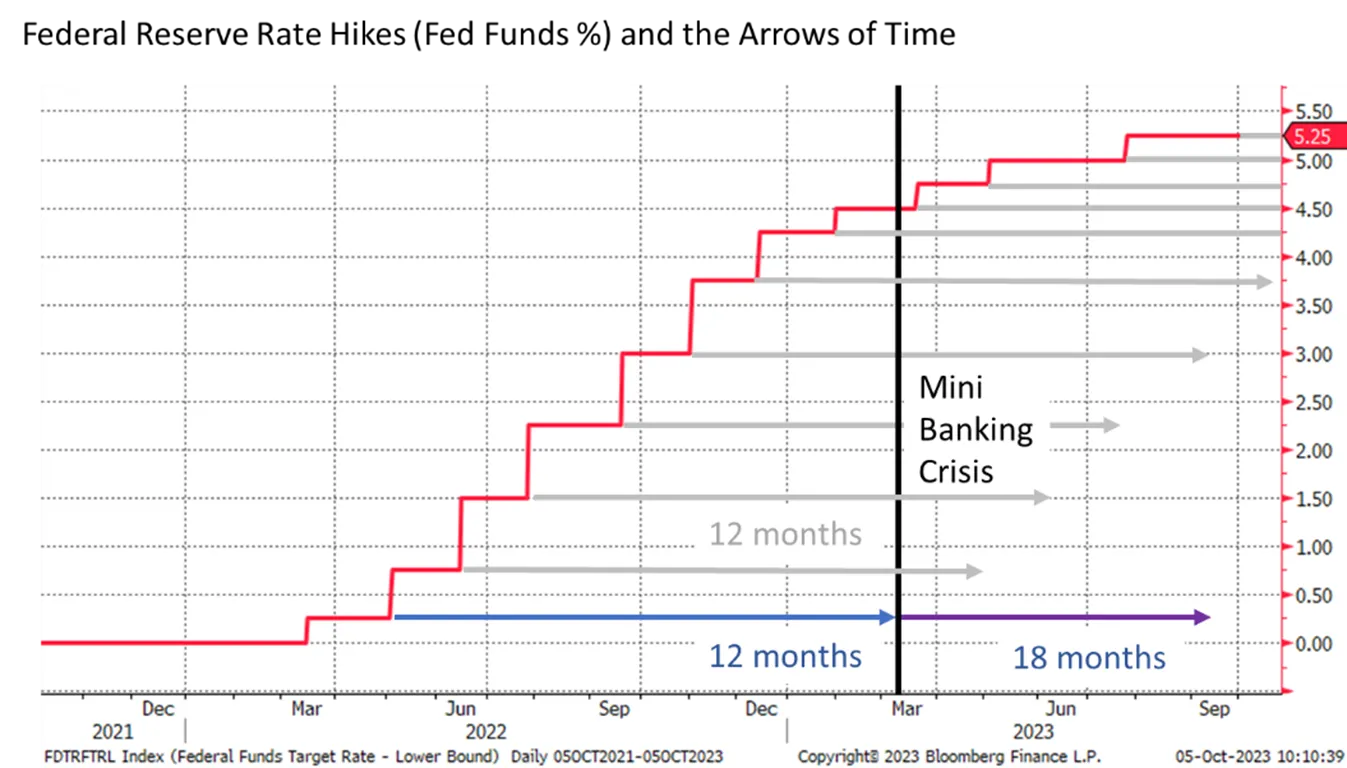
It is often said that each rate hike takes some 12 – 18 months to impact the real economy. Milton Friedman famously stated that any impact from changes to monetary policy happens only with “long and variable lags,” which no one, not even he, has been able to quantify. Most studies show a quicker response to rate cuts than rate hikes, and some suggest that tightening monetary policy reverberates for years into the future.
Considering the 12–18-month metric (see Federal Reserve Rate Hikes and the Arrows of Time below), it is curious that the collapse of Silicon Valley Bank and the onset of the mini-banking crisis happened almost exactly 12 months after the Fed first hiked its Funds Rate this cycle. Please see chart below graphically demonstrating how much time passed since the first rate hike and the collapse of Silicon Valley Bank which happened to be a period of 12 months. Please note that if each rate hike has a lagged effect of a year-plus then we should consider that future impacts of previous rate hikes are likely yet to be felt. We are now a year since the Fed Funds reached 3.0% yet that interest rate is already at 5.25% and likely to impact our future selves. It is now a little over 18 months since that first interest rate increase, and 12 months since the Funds Rate reached 3.0%. Perhaps the calendar explains the rising anxiety over the path of rates and the duration of the current policy stance. Regardless, it is likely that the economy has yet to experience the full effects of Fed policy over the past year and that many more impacts will come.
These lags may also explain why Fed officials are so deeply divided about their expectations of monetary policy going forward. At the September FOMC meeting, the Fed published its projections, including the famous “dot plot” graph of individual members’ expectations of where the Fed Funds will be in the future. While the group narrowly expects one more rate hike before the year’s end, the divergence of opinion grows dramatically from there. This clearly indicates individual members’ confidence that the Fed will achieve its goals or fail to do so. The range of opinions for 2025 is astonishing and shows an unprecedented spread among outcomes.
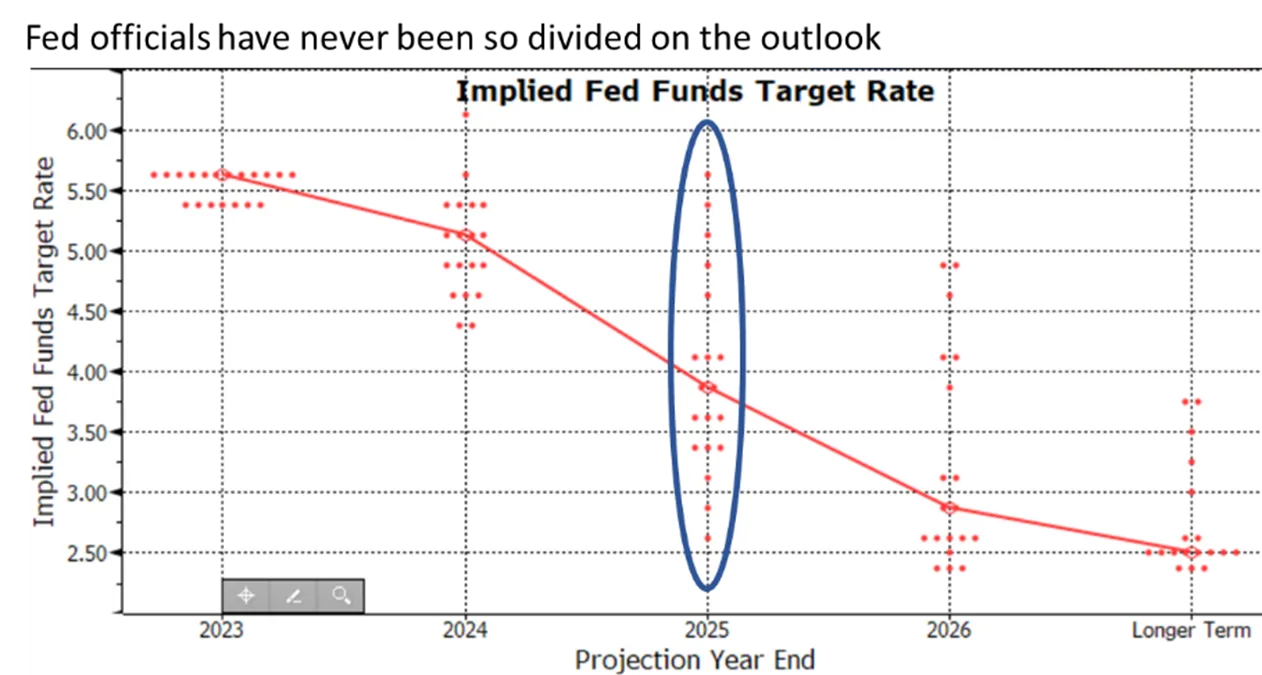
In the end, opinions vary over whether a soft landing is in the cards. The longer inflation remains elevated and the longer the Fed must maintain a tight monetary stance in response, the more likely the resultant stresses will lead to a recession. While 2023 seems to be out of the woods on that front, (barring a worsening of the crisis in the Middle East, which could have a myriad of negative impacts to the economy and sentiment), worries about 2024 continue to mount.
Markets Year-to-Date – A Slowing Economy, But Better-Than-Expected Market Performance
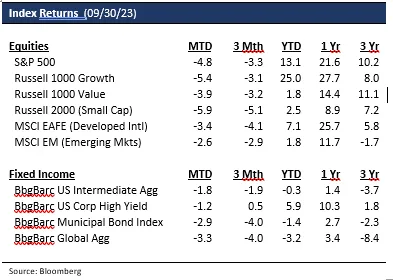
2023 was expected to be a ho-hum year for the markets, with a tough first half followed by a more sanguine second half of the year. A laundry list of headwinds was expected to stifle markets: slowed economic growth, the Fed’s “higher for longer” mantra on rates, a tightening lending environment for consumers and businesses, the U.S. debt ceiling, and muted corporate earnings growth. Fast forward to the end of September, and most global equity markets (with the exception of China and Australia) have had a relatively good run, including the S&P 500. Fixed income markets have had another lackluster year, with short-duration U.S. bonds notably outperforming long-duration bonds. Since late summer though, we have seen choppier U.S. markets and rising volatility on the back of higher yields.
Year-to-date (YTD) returns for the S&P 500 have largely followed the same monthly seasonal pattern for the past 50 years. If the past is any indication, the September market drawdown may continue into early October before the start of a classic end-of-the-year run. Of course, given the persistence of many headwinds, we are not assuming this to be a given. With 2023 U.S. GDP growth higher and closer to the 2% range and corporate earnings growth exceeding investor expectations, growth-oriented sectors in the U.S., such as tech and consumer discretionary, have regained leadership this year over value-oriented sectors such as energy, utilities and consumer staples. In contrast, developed and emerging markets collectively lagged the S&P 500’s performance, up 7% and 2% YTD respectively, with the latter weighed down by China’s underwhelming -7% return, (which ranked last among major emerging markets). Short-term cash instruments (money market funds, short-term Treasury bills, CDs) now offer 5%+ yields not seen in over a decade.
What’s Ahead: Consumer Headwinds, Extended Recession Timing, Favorable Seasonality
At the start of 2023, it seemed a consensus view that we would revisit the bear market lows of October 2022. Instead, using that date as the starting point and adopting the 20% upward move definition for a bull market, the S&P 500 closing price in early June briefly met the technical definition of a “bull market.” Since then, while there have not been any major shocks (i.e. credit or economic), markets have primarily trended down due to concerns over rising yields. It remains to be seen whether 2023 market returns follow historical patterns. Historically, the second year of a Presidential cycle (here, 2022) typically has the weakest returns within a 4-year cycle, which played out last year. However, the third year of a Presidential cycle (here, 2023) typically has the strongest returns. However, we have a long way to go before matching history.
September’s Federal Reserve meeting helped fuel the month’s reputation as the worst month in the annual calendar for stocks. While the Fed raised its 2023 GDP growth estimate to 2.1% (from 1%) and the 2024 GDP growth estimate to 1.5% (from 1.1%), its dot plot, however, signaled that rate cuts would likely be further out in the future than investors anticipated. Specifically, the dot plot implied one more rate hike in November (widely expected) and two rate cuts in the second half of 2024 (a more extended timeframe than was expected). Rising yields hurt long-term bonds, growth stocks and bond proxies, such as Utility and Real Estate equities. We expect the lagging impact of rate hikes to flow through to various sectors of the broader economy.
With mortgage rates crossing 7.5%, credit card and auto loan defaults past the 7% mark, and credit card rates above 20%, we expect the consumer to face rising headwinds. For instance, gas prices surged 20% since August, and the potential October resumption of student loan payments negatively impacts approximately 40 million consumers who will have to cope with a $400-500 per month average loan payment. Echoing this concern about consumers have been leading mass market retailers such as Target, Wal-Mart and the Dollar stores, along with high-end retailers such as Restoration Hardware, which collectively reported consumer spending weakness across the entire income spectrum. With the U.S. consumer responsible for two-thirds of the U.S. GDP, we are closely monitoring both employment trends and the health of the U.S. consumer to help shape our views regarding potential slowdowns, alongside corporate spending trends. In addition, our timeline for what may be the most well-telegraphed (and likely shallow) recession has been pushed out into 2024 given robust employment trends and a potentially improving earnings growth outlook. This timeframe is consistent with how many days it has taken over the past 50 years, from the start of when the 10-year versus 3-month yield curve inverts to when a recession officially begins.
Correspondingly, investor sentiment on stocks has turned the most bearish since May. The latest American Association of Individual Investors (AAII) survey showed over 42% of investors expecting stock prices to fall over the next six months. Historically, whenever bearish sentiment has been well above historical averages, it has boded well for S&P 500 returns over the next 6 and 12 months. This coincides with favorable seasonality since the fourth quarter has historically been the best 3-month stretch for equities. We would also be remiss if we did not point out the disconnect between bond market and equity market investors. While recent bond market action has been skeptical of YTD market performance in a tightening credit environment, equity investors have been more bullish on the back of better-than-anticipated market earnings growth.
A Thaw in the Capital Markets – Signs of Cautious Optimism?
One encouraging note has been the recent spate of Initial Public Offerings (IPOs) to hit the market since summer. Due in part to the 2022 market downturn and the subsequent resetting of valuations both in the public and private markets, the IPO market hit a wall over the past two years. Until September 2023, when grocery delivery company Instacart did its IPO, it had been nearly 18 months since a prominent, venture-backed company went public in the U.S. Per Ernst & Young, there have been 968 IPOs globally year-to-date raising a total of $101 billion, which represents a 5% and 32% year-over-year decline respectively. In the U.S., the IPO activity prominently featured the technology sector, with the most prominent IPOs being Arm holdings (the British semiconductor and software design company) and Klaviyo (the marketing automation software firm), although there were fewer blockbuster tech IPOs relative to 2021. Second on the list was the Consumer Discretionary sector, prominently featuring Instacart and Cava holdings (the fast-casual Mediterranean food chain).
While it is encouraging to note a thaw in the IPO market and a recent rise in blockbuster mergers and acquisition (M&A) deals (e.g. networking company Cisco’s acquisition announcement of cybersecurity provider, Splunk, and Pfizer’s proposed purchase of the cancer-drug company, Seagen), IPO after-market performance has lagged. In each of these cases, shares trade around or below the original IPO price, suggesting a risk-off mentality among typical growth investors. Moreover, the IPO valuation at times has represented a steep discount to their last private venture financing around. In Instacart’s case, its $9 billion IPO valuation was 75% off its $39 billion valuation from its last pre-IPO VC funding around. We see this as a precursor to more valuation resets within the private market as more headliner IPOs fill the pipeline.
Portfolio Implications – U.S. Equities Slightly Overvalued, Bonds More Appealing, International Markets Relatively Cheaper, Alternatives A Volatility Dampener
After 2022 when bonds had their worst returns in over 40 years and equities suffered a garden variety bear market, 2023 has been relatively tamer by comparison. Ahead of the Fed’s tightening cycle in 2022, we were appropriately skeptical of longer-term bonds and preferred shorter-duration bonds instead. Due to the unprecedented 500+ bps hike in rates since March 2022, cash-like instruments such as CDs, money-market funds and shorter-term Treasury bills now offer yields in the 5-5.5% range. Consequently, a wall of money has flowed toward money market funds, pushing such assets above $5 trillion. While we have seen record interest from both institutional and retail clients alike in such vehicles, we have been pointing to history as a guide to why it may make sense to reallocate a portion of funds away from cash. Based on the past several rate hiking cycles, when the Fed is at or close to the end of the hiking cycle, bonds and equities have outperformed cash in the following years. We favor adding to core bonds in the belly of the curve since shorter-term bonds would face greater reinvestment risk should the Fed begin to cut rates.
Accordingly, we have been working on increasing the duration of our fixed-income portfolios. Despite a modest chance that inflation could still spike (due to either wage inflation or energy price rises), which would cause the Fed to keep raising rates even as the economy weakens, core bonds still offer a good opportunity for investors to lock in higher rates before they head south. We are not as constructive on corporate high-yield bonds or floating rate loans given the risk of rising defaults in a weakening economy. Given a spate of headwinds facing the economy and the relative outperformance of stocks over bonds since the start of 2022, we believe bonds offer better relative risk-to -reward than stocks. Based on one of our favorite relative valuation metrics, which involves comparing the earnings yield (the inverse of the price-earnings ratio) of the S&P 500, currently around 5%, to the 5%+ yield on intermediate-term bonds, bonds seem to offer better risk-adjusted returns than stocks. In short, TIAA (there is an alternative) now. Of course, within our various diversified portfolios, we maintain a healthy mix of stocks and bonds tailored appropriately to the type of risk suitable for clients.
For equities, the late spring to early summer rally driven partly by excitement around the potential of Artificial Intelligence (AI) stalled in the third quarter, with markets 6% off highs and down 5% in September. 2023’s rally has largely been driven by growthier technology, communication services and consumer discretionary sectors, while defensive sectors such as healthcare and bond proxies like utilities and real estate have lagged. The rally in the S&P 500 has largely been driven by the “Magnificent Seven” stocks (Apple, Amazon, Alphabet, Meta Platforms, Microsoft, Nvidia and Tesla); however, the median stock in the index has been flat. On a forward price-to-earnings (PE) multiple basis, the S&P 500 trades at 18.0x, making it 7% overvalued relative to historical averages. Historically, 5-year forward returns for the S&P 500 have averaged 5% at these valuation levels.
As we enter October, a rally into year-end is not a given and is partly predicated on a strong third quarter corporate earnings reporting season. Based on consensus estimates, third quarter earnings per share (EPS) growth is projected to be flat. If this is true, it would mark the first quarter of sequential earnings acceleration this year and imply second quarter earnings may have been the trough. The current consensus is for modest 2023 earnings per share (EPS) growth for the S&P 500 to $221, and 12% EPS growth for 2024 to $246. We believe current earnings projections may be a tad more optimistic given the headwinds to earnings growth.
Given that most tech companies significantly downsized in 2022, we also believe techs could lead the way, driven by a pick-up in demand, adequate pricing power and a nimbler cost structure than a couple of years ago. We are not ready yet to pick a side between growth and value; hence, we are keeping portfolios relatively style neutral with a bias toward large-cap, dividend-paying equities. However, should we see signs that markets might turn a corner and earnings growth accelerates, we stand ready to take a more aggressive posture toward growth and small-cap equities, which have notably trailed large cap equities over the past 10 years. Given that developed market equities trade at a 20% discount to historical norms and at a steep discount to U.S. equities, we believe a healthy dose of non-U.S. equities will always make up a portion of our diversified portfolios.
Finally, a word on Alternatives. Across most of our diversified portfolios, we believe having a healthy allocation to liquid alternatives (e.g. Long/Short Funds, Volatility-based Income Vehicles, Global Infrastructure, Real Estate) can dampen overall portfolio volatility while adding non-correlated return streams. In an uncertain investment landscape where financing costs are higher, we believe there will be greater differentiation amongst winners and losers in the Alternatives world, and we thus expect to spend more time on alternatives manager selection in the months ahead.
Wealth Management does not provide accounting, legal or tax advice. This information discusses general economic and market activity and is presented for informational purposes only and should not be construed as investment advice. Views and opinions expressed herein do not account for any specific investment objective, restrictions, and/or financial circumstances of any specific client. Investors are urged to consult with their financial advisors before buying or selling any securities.
Different types of investments involve varying degrees of risk, and there can be no assurance that any specific investment will either be suitable or profitable for a client’s investment portfolio. The investment return and principal value of investment securities will fluctuate based on a variety of factors, including, but not limited to, the type of investment, amount and timing of investments, changing market conditions, currency exchange differences, stability of financial and other markets, and diversification. The statements and opinions expressed in this article herein are those of the author as of the date of the article and are subject to change. Content and/or statistical data may be obtained from public sources and/or third-party arrangements and is believed to be reliable as of the date of the article.
Products offered through Wealth Management are not FDIC Insured, are not bank guaranteed and may lose value.

